

ScholarTribe Climate Briefing IX
ScholarTribe Climate Briefing IX
UK Heatwave Special

Drum roll please… it’s the UK heatwave special! In this edition, we’ll be taking a good, hard look at the 2 days of ridiculous temperatures that we experienced a couple of weeks ago. While you’ve probably heard a great deal about this heatwave in the news, today we intend to specifically look at the event from a climate change perspective, and see what it tells us about the evolving dangers of extreme weather. It does get quite technical, so prepare yourself for some maths and stats!
Also in the news in the past couple of weeks - fusion ignition was confirmed to have been achieved by the National Ignition Facility in California; it finally rained in the UK; and Taylor Swift was revealed to be top of the list of celebrity private jet usage in the first half of 2022 (170 flights in 200 days!).

Some quick links
Three papers highlight results of record 1.3 megajoule yield experiment
Podcast: Why is England so vulnerable to droughts?
Read about Taylor Swift (and others)
The attribution study we are discussing today
The UK’s hottest ever day
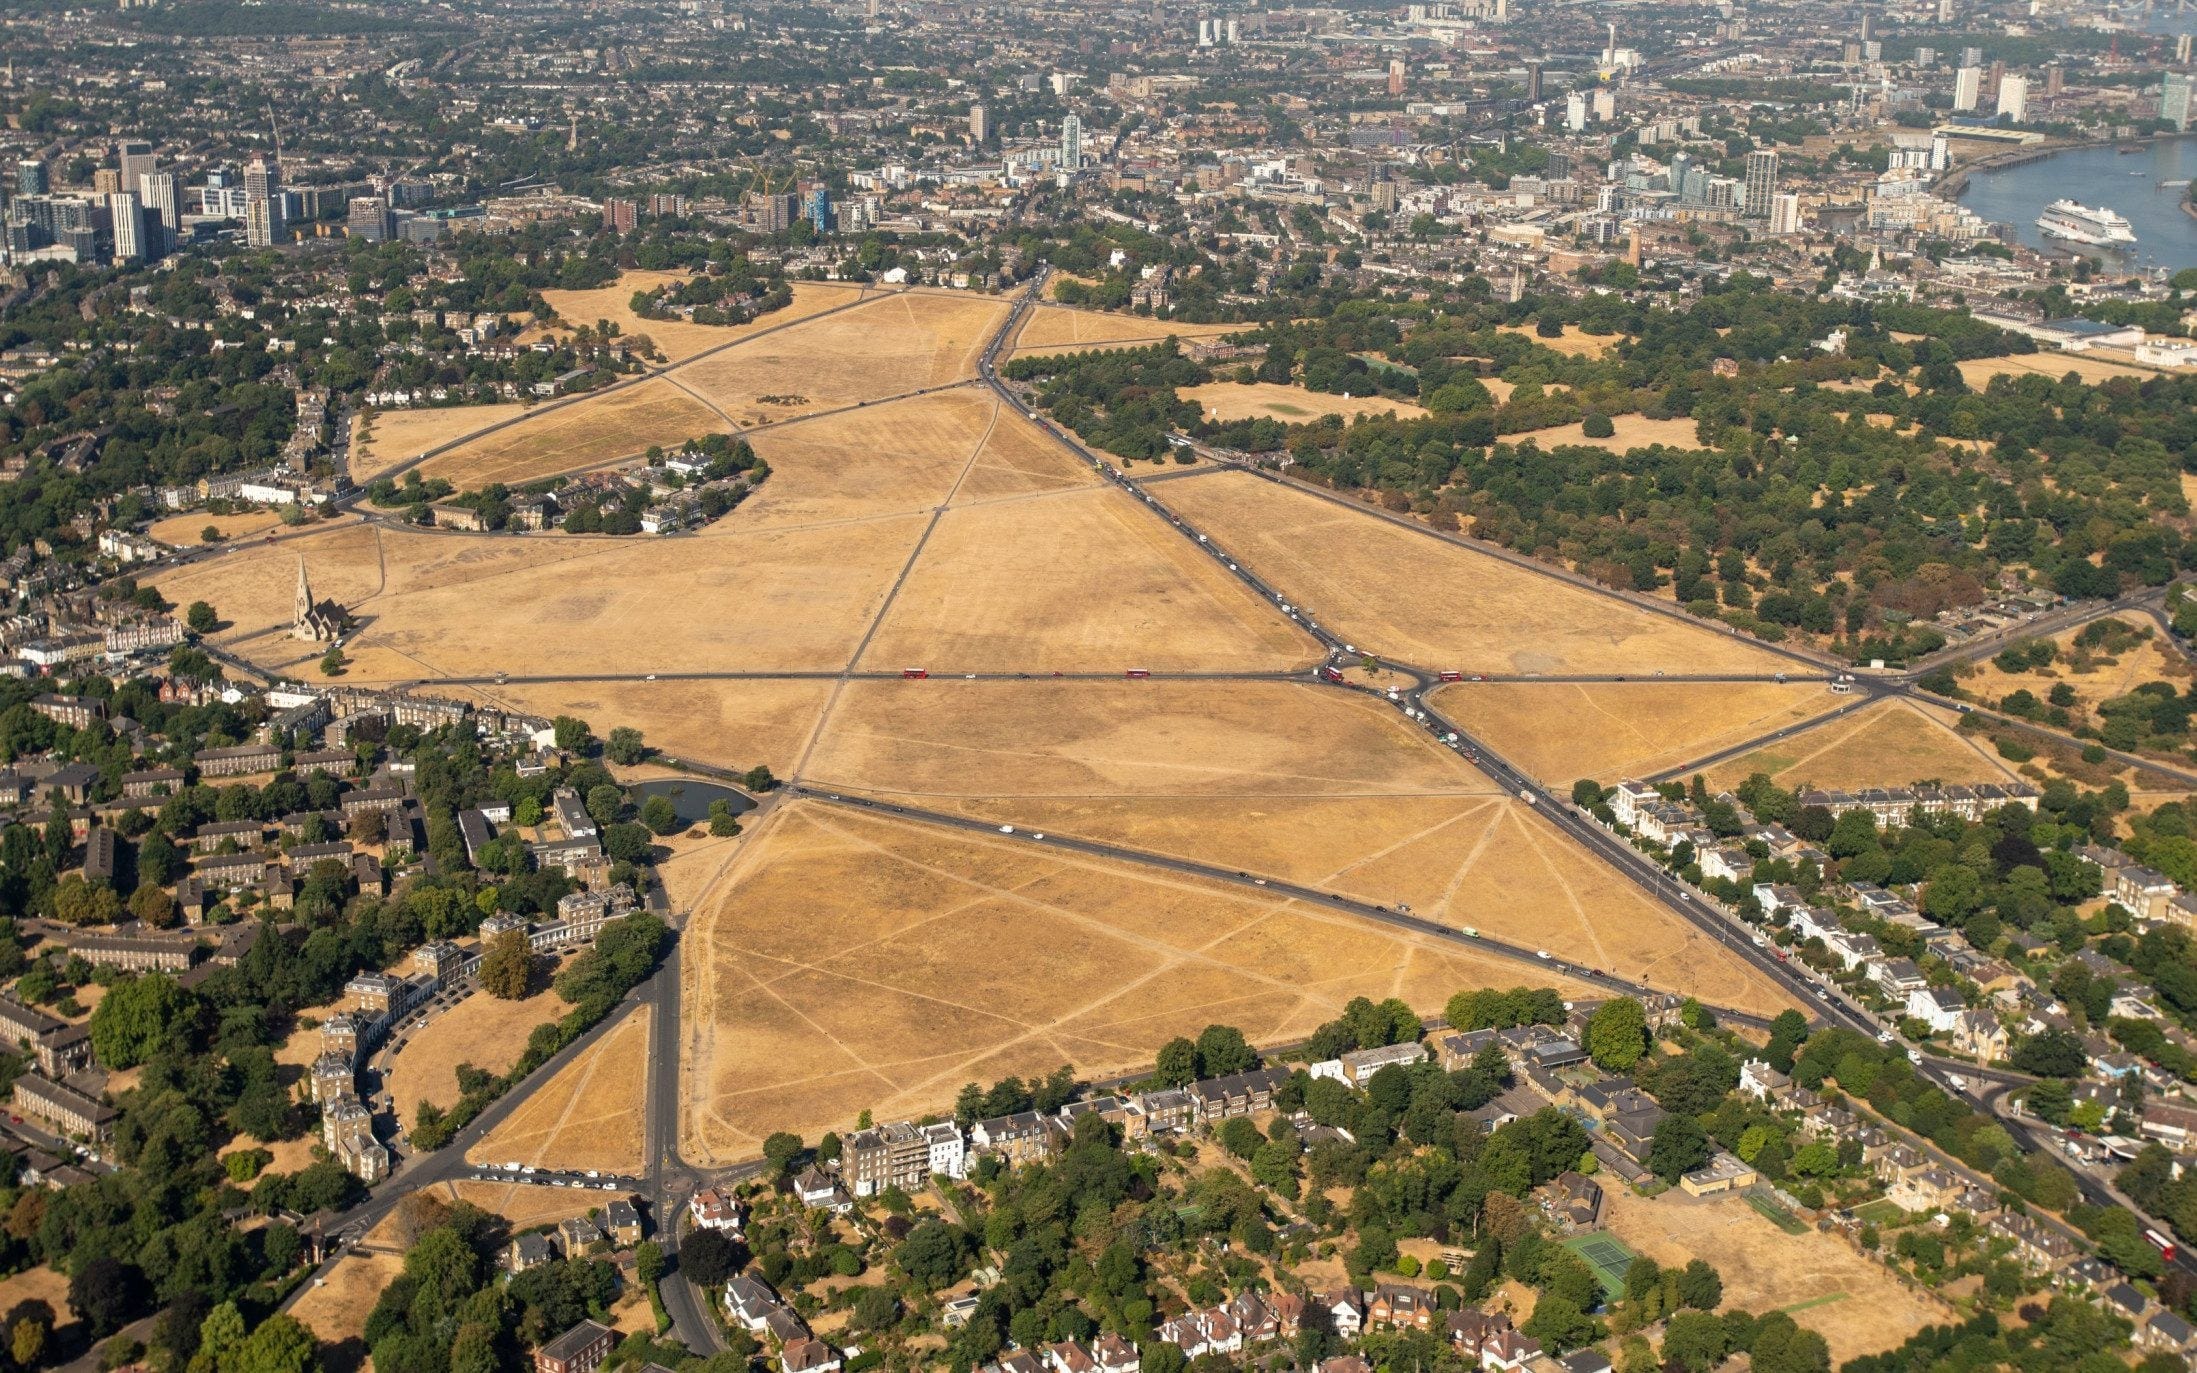
On the 18th and 19th July 2022, temperature records across the UK were broken in dramatic fashion. Just 3 years ago the previous record was set in the botanical gardens in Cambridge, at a rather toasty 38.7°C, but this year the bar was raised all the way up to 40.3°C - a record that was set in Lincolnshire. And it wasn’t just the daytime temperature that was exceptional; between the two days the temperature only dropped down to 25.8°C in Surrey, which is a new overnight record.
A notable feature of this event is the fact that it was so well forecast. Weeks in advance, medium range forecasts were simulating 40 degree days, with rapidly increasing confidence. Another, perhaps crucial, feature of the heatwave is the fact that in the months leading up to it the UK experienced a severe lack of rainfall. Dry soil is known to exacerbate heatwaves, which then makes the soil drier, which then makes the heatwaves even worse, and so on.
The big question is whether we were just unlucky to have experienced this event, or if it is due to climate change. Untangling these two possibilities is called extreme event attribution, and the answer, as we will discuss below, is a bit of both. Here we will summarise a study by the World Weather Attribution team, who have produced a rapid analysis of the UK 2022 heatwave.
Step 1: Define your event
The first step in event attribution is to scientifically define your event. This might seem a bit obvious - “well it’s the heatwave innit” - but we have to be much more careful than that. This has to be something that we can compare between different models and years’ worth of observations.
In the case of our study here, the WWA team picked two event definitions. The first was just the daily maximum temperature recorded (e.g. the 40.3°C record), and the second was the 2-day average over the 18th and 19th of July. Area-wise, they chose a box that covers most of the extent of the heatwave (remember the red heatwave warning issued by the Met Office), and then they also looked at three specific weather stations in St James Park, Durham and Lincolnshire. To summarise, that’s two event definitions, with four geographical extents (3 points, 1 area).

Step 2: Look at the historical data
Once you’ve squared off your event definition, you then need to look at historical observations using those same metrics. So that means for each year finding the hottest individual temperature recorded, and then the hottest 2-day run of temperatures. Once you have all these, you can then plot a distribution, and look at how the 2022 event compares to it.
But this doesn’t solve the problem of isolating the impact of climate change. To do this, we have to shift each data point depending on the current level of global warming at the time. So a data point from 1900 would have to be shifted up in temperature to reflect what it might have been like if it happened in today’s climate, for example.
The opposite is also done, to get another dataset that represents a preindustrial climate. The same data points are used, but rather than topping up the temperature to reach current levels of warming, any global warming present is instead deducted from the temperatures.
If this seems initially confusing, it’s because it is! Hopefully the figure below helps though - it is called a return period diagram. The red and blue points are from the two datasets we just described, with red being the present day and blue being preindustrial. Each dot is an observation from a certain year, and the temperature of that dot is shown on the y axis. The x axis then shows how often we would expect to see a yearly max temperature at least as hot as that value.
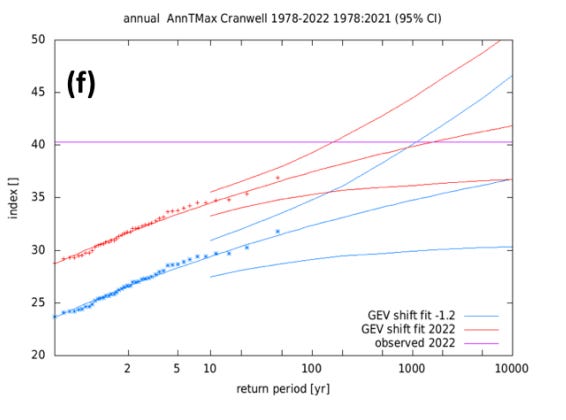
To give an example - in the present day in Cranwell (red dots), we would expect to see a yearly max temperature of 33 degrees (y axis) once every 5 years (x axis).
Step 3: Run the numbers
Now we have set up these return period plots (8 of them, because we have 4 locations and 2 event definitions), we can start looking at the 2022 event. On the above figure, this is shown by the magenta line. The return periods for the heatwave in pre and post industrial climates are simply found by reading off where the middle red and blue lines cross the magenta one. This gives us two return periods, which we can turn into one “risk ratio”, by dividing the 2022 return period by the preindustrial one. This risk ratio is our magic number, and says how much more likely the heatwave was made due to human influence.
So what’s the risk ratio in this case? Well, we have to be super careful when we work this out, due to all sorts of biases, statistics and uncertainty. And we also have to consider the different event definitions, and different ways of carrying out attribution. But in this case, the risk ratio was deemed to be at greater than 10, with very high certainty.
So that’s it - the heatwave was made at least 10 times more likely due to climate change. But what of our other question - were we also just unlucky? Well, on the way to calculating this risk ratio of 10, the WWA team estimate that the observed temperatures over the 2-day average have a return period of 100 years - they had a 1% chance of happening! So yes - the heatwave was made more likely (and more potent) due to climate change, but we were also very unfortunate to have experienced it.